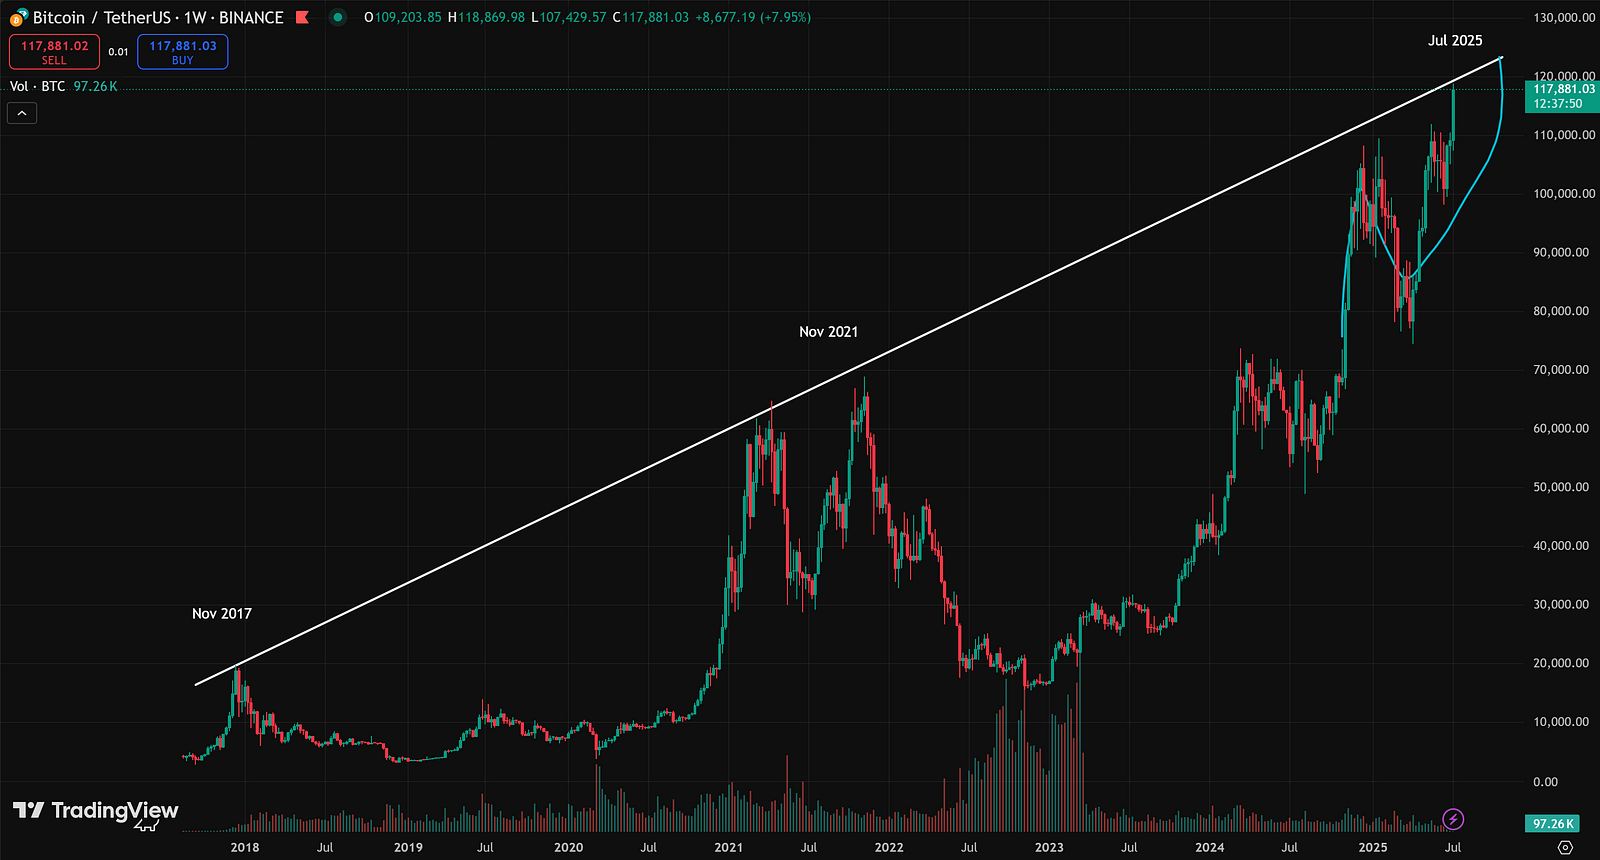
Bitcoin is currently coasting just under its new all-time high, trading at $117,800.
Alts have started to slowly wake up too, as the air fills with anticipation, as the market starts being driven by greed once again (68/100 according to the index).
I’ve seen predictions anywhere between $100k to $500k and over, and I wanted to give my take on where the market, and naturally Bitcoin, is ultimately headed during this bull run.
Note that, at best, this is just an educated guess based on the available information and in no way an absolute target.
For our analysis, we’ll be mainly looking at:
- Market Data
- ETF Impact
- Political and other Macro factors
Bitcoin Market Data Prediction
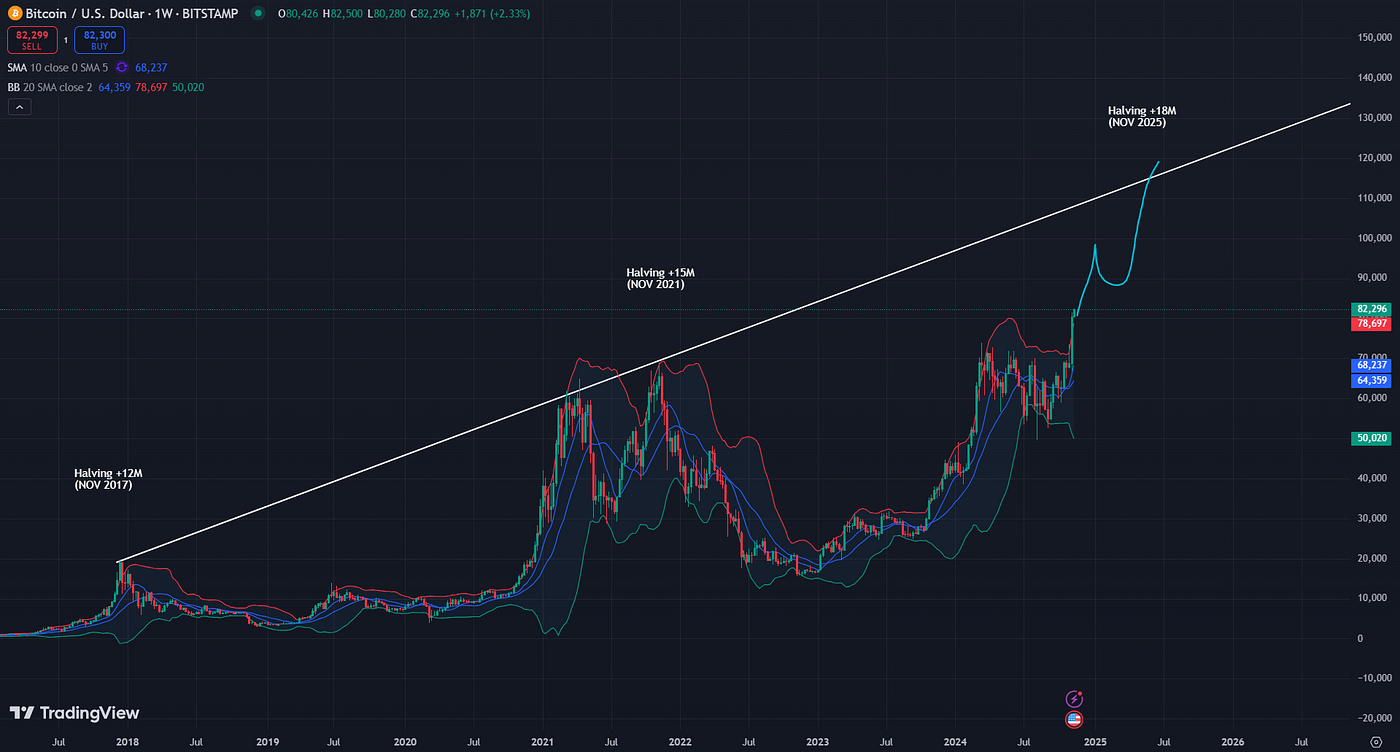
If we add resistance levels to previous all-time-high peaks, we’re looking at a trendline indicating a ceiling of around $120,000 for this run.
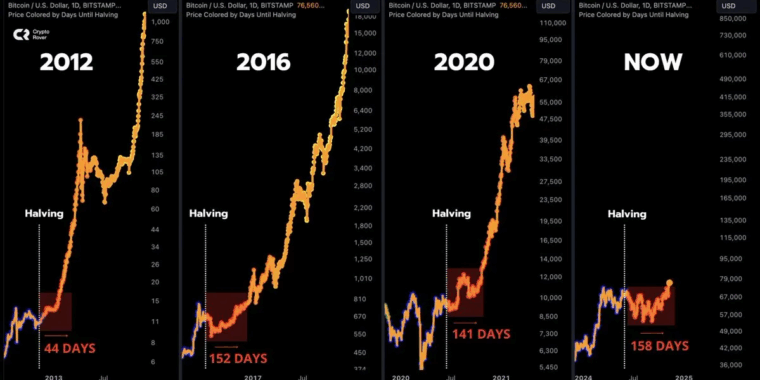
A few months ago, I posted this image:
The chart trendline explained that new cycle all-time-highs tend to happen in November, the year after the previous Bitcoin halving.
And here we are in July 2025, already knocking on that crucial level.
This is a crucial level, so let’s understand whether there’s potential to break it. And if so, how high can Bitcoin really get during this bull run?
Bitcoin is programmed to halve its mining rewards roughly once every 4 years, or once every 210,000 blocks, to be more precise. On average, each block takes about 10 minutes to complete, hence the 4 year period.
This has a profound impact on the Bitcoin supply, which historically has been a consistent indicator preceding a new bull run.
Post-halving price movement
Now, what’s really going to bake your noodle is that we can plot and predict the Bitcoin all-time high based on the existing pattern. The bull cycle doesn’t reach its peak until about a year (give or take a couple of months) after the halving.
Take a look at the above chart for a second. You’ll see that regardless of when the halving took place (whether it’s April, July, or November), a new all-time high always happens in November the following year.
In this cycle, that would be November 2025. Assuming the date remains consistent, we just plot the price based on our trendline.
One way to do this is to draw a resistance line at the peak of each bull market cycle. The final step is to check where the resistance line crosses November 2025.
According to this trendline, we’re looking at a potential price of around $120,000 for this bull run. However, Bitcoin broke the pattern here but touching the resistance line a couple of months earlier than expected.
And if you look at this latest section of the chart, we can count at least 3 other instances where the price is getting very close to the trendline.
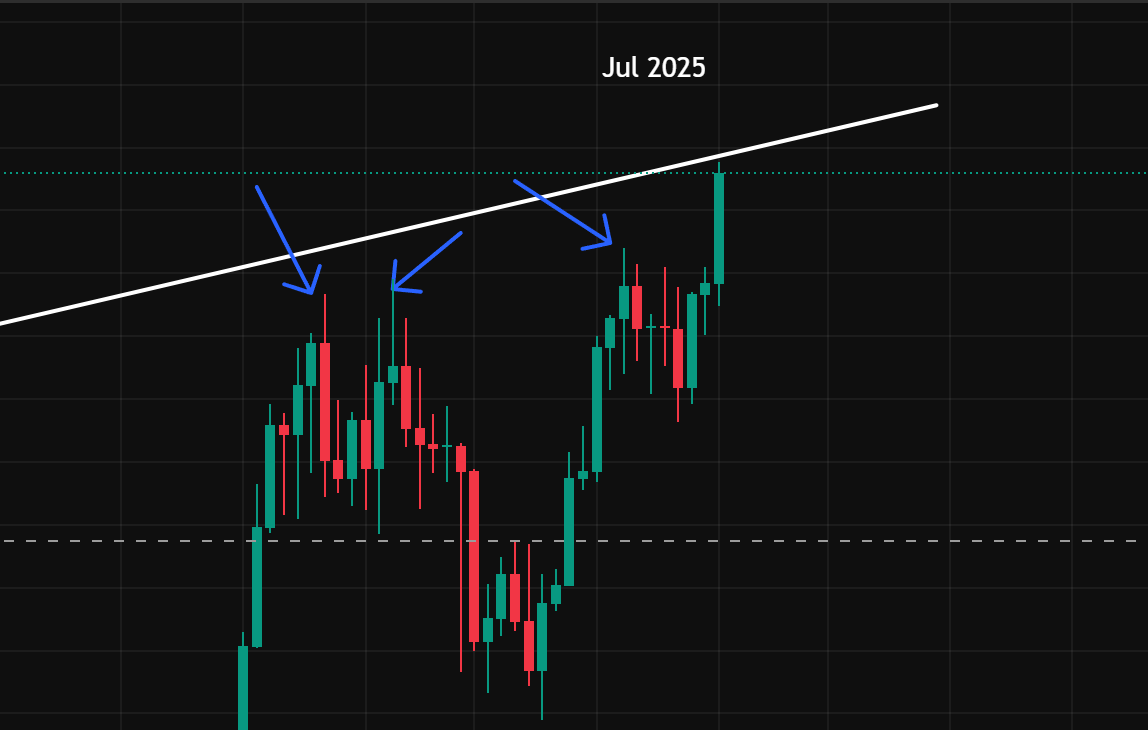
The bullish way to interpret this would be that, due to adoption and regulation, Bitcoin has a lot more momentum this time around. Meaning that the $120,000 level may very well be just the beginning for this bull run.
Consider the recent trading volume for BTC:
Bitcoin Daily Trading Volume
The chart below shows the daily Bitcoin trading volume according to CoinMarketCap data.
We haven’t even reached the previous all-time high levels of volume, confirming that there is still quite a bit of upside left.
Bitcoin ETF Impact
This section seeks to highlight the impact of institutional adoption. On November 11, 2024, BTC ETF inflows broke $1.3B — the highest-ever figure we’ve seen so far.
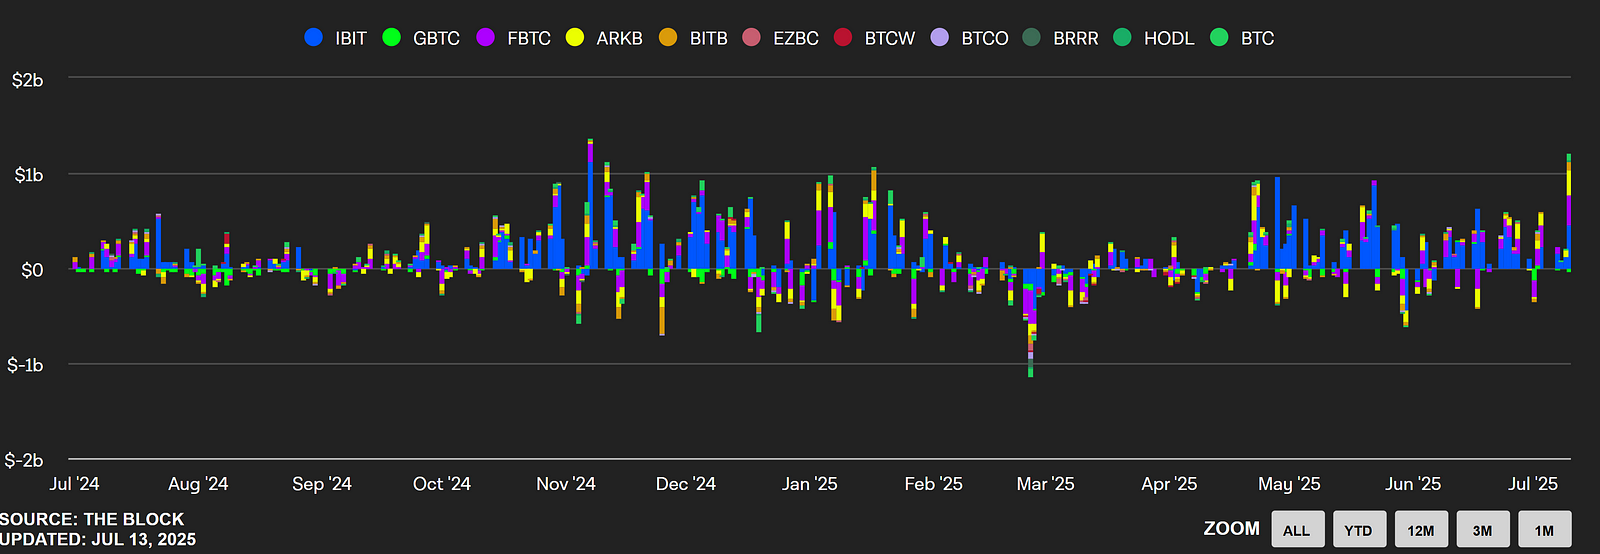
However, this is where you can gauge the potential. As of today, the total Cryptocurrency market cap is at a record high of $3.84 Trillion US dollars.
Binance, the biggest cryptocurrency exchange, has recorded a Spot volume of over $5 billion US dollars, and about 50% of those are buys — or in-flows.
That means that currently, Binance is experiencing twice as much Bitcoin inflow volume than all other ETF offerings combined.
Now consider that the Global Stock Market — which ETFs are a part of — has an estimated market cap of over $110 Trillion US dollars — nearly x40 bigger than the total cryptocurrency market cap.
The fact that Binance is seeing considerably more inflows than all ETF offerings combined is extremely bullish. It means that retail is not in. But that might not be for long.
Bitcoin Google Trends Data
The fact that Bitcoin is trading at $117,000 and the trends data shows little activity could be a very bullish sign as well.
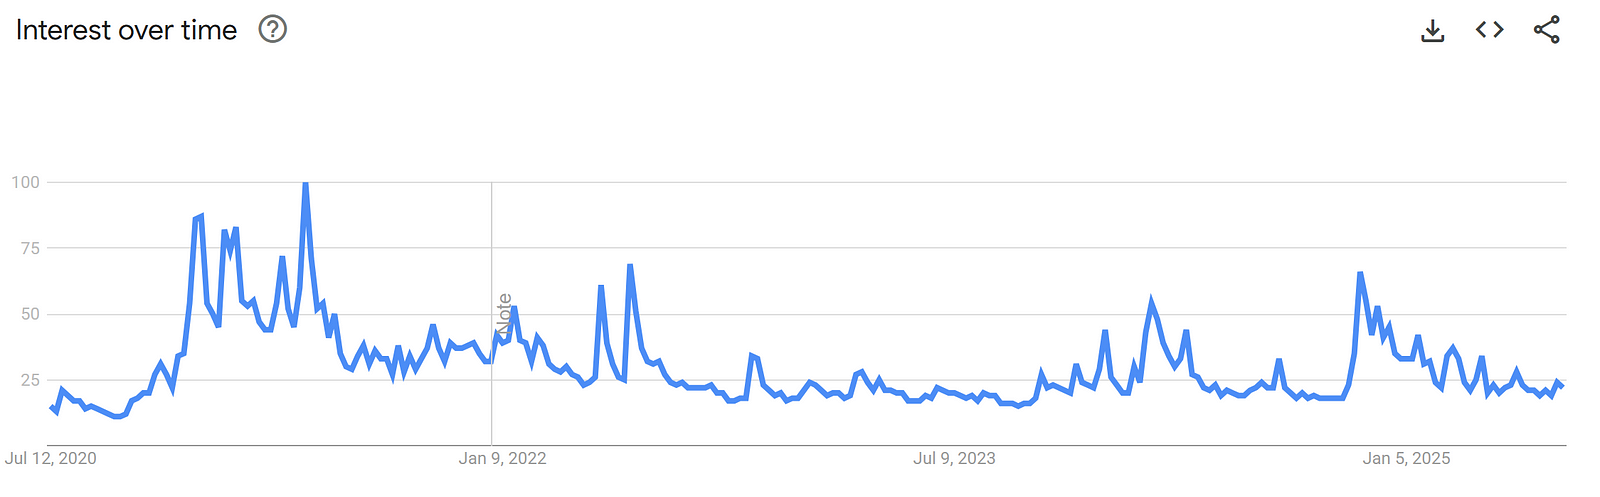
Markets tend to signal a top when euphoria is dominating the space. This gets other people interested, thus causing search activity and interests to spike dramatically, as you can see above around previous cycle tops.
This section is not so much predicting a specific price but rather making the case that while we’re on our way to target $120,000, there’s more, and I mean a lot more upside this market cycle.
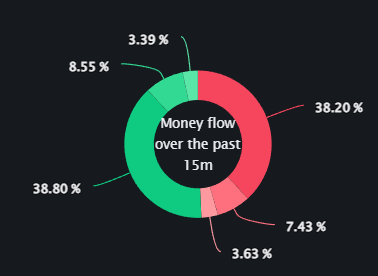
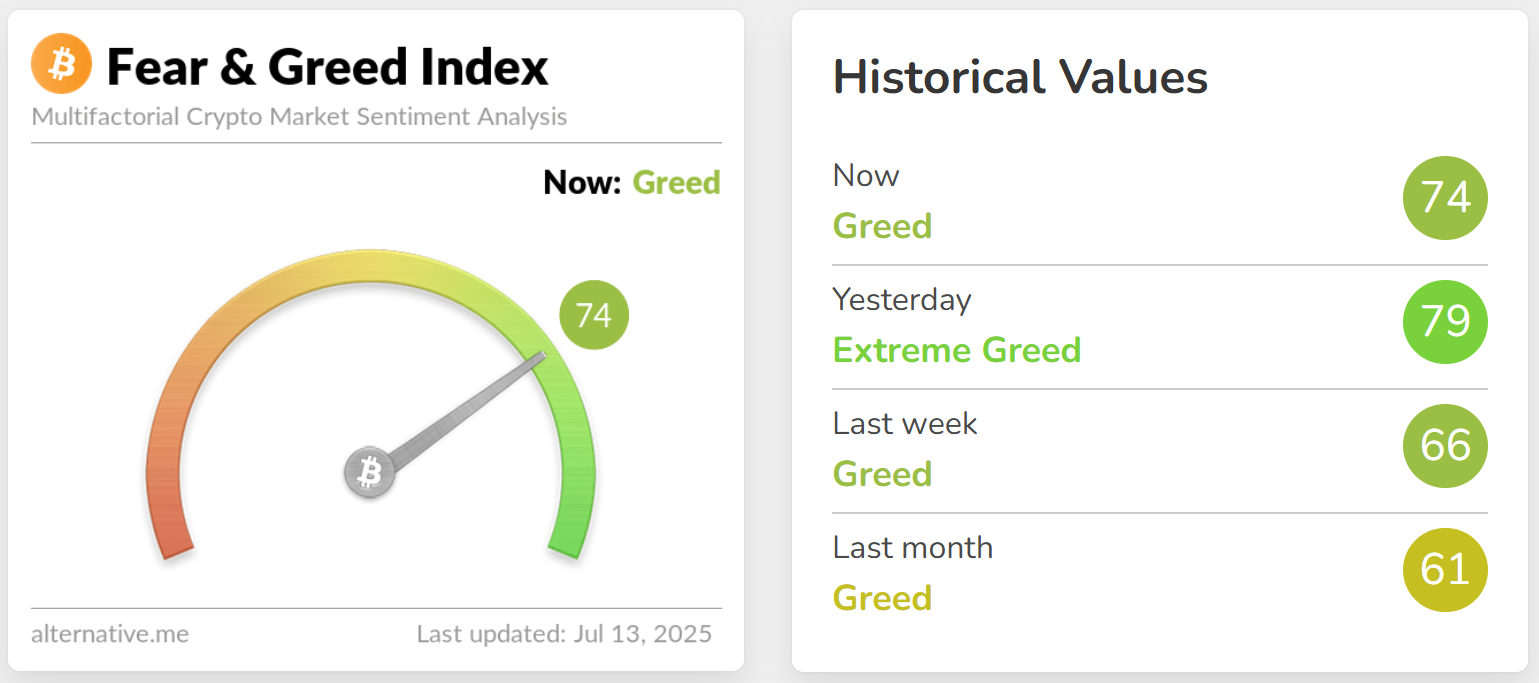
Bitcoin Fear and Grid Index
This one’s not so much of a long-term indicator, but I decided to throw it into the mix anyway for anyone looking for more short-term decisions.
The needle is oscillating between Greed and Extreme greed. This is a dangerous territory, as money keeps flowing in and pressure builds towards an inevitable correction.
This is not to say that it will happen right away, but any rally eventually sees a correction.
In the previous bull run, we saw a strong rally, a sharp correction, followed by a very short period of consolidation, and then another massive rally.
The only difference is that we’re a bit early for that during this cycle, which means we could go higher than $120,000 after another correction.
Market Analysts and Permabulls
Several analysts predict Bitcoin could reach between $200,000 and $250,000 by the end of 2025.
For instance, Tom Lee from Fundstrat Global Advisors forecasts $250,000, citing the impact of spot Bitcoin ETFs and U.S. political shifts. Bitwise Asset Management aligns with a $200,000 target, driven by institutional investment.
Tim Draper, a venture capitalist, also predicts $250,000 by year-end, emphasizing Bitcoin’s potential as a dominant currency. However, other analysts suggest a lower range, from $75,000 to $155,000, indicating the wide variability in expectations.
Michael Saylor, known for his additional slice of Pizza, predicts Bitcoin could hit $5 million by 2030, based on a “Power of 21” thesis linking growth to its fixed supply.
Cathie Wood from Ark Invest focuses on 2030, with predictions ranging from $500,000 to $2.4 million, reflecting her firm’s confidence in Bitcoin’s long-term potential, though specific 2025 targets are less detailed.
Conclusion
To sum it all up, the most conservative estimate for this run would be $120,000.
However, with institutional adoption starting to roll in and potential plans for the US government to roll out a strategic Bitcoin reserve plan, the bull case for Bitcoin could look a lot more optimistic.
Between a conservative top of $120,000 and an optimistic $250,000, maybe a middle ground of $175,000 is in order.
What do you think? Let me know in the comments below.
If you’re into algorithmic trading and looking for a no-code solution, check out crypto trading bot platform Aesir. Get 20% OFF with code AESIRPOT20.
Enjoyed this article?
Sign up to the newsletter